
What is Predictive analytics?
With the aid of methods like data mining, statistics, data modeling, artificial intelligence, and machine learning, predictive analytics calculates the likelihood of future events.
Simply said, predictive analytics analyses past data from an organization to produce future projections. Today’s predictive analytics approaches can find trends in the data to help a business foresee impending hazards and opportunities.
What are some common predictive analytics techniques?
Predictive analytics has a wide range of potential uses, and the models that underlie the insights they produce also vary greatly.
Starting with a clearly defined target can help you decide which predictive analytics techniques are suitable for your firm.
These four categories roughly classify the different types of predictive analytics models:
- Regression models
- Classification models
- Clustering models
- Time-series models
Regression Models
Regression models gauge how strongly two variables are related. To anticipate future effects, the model keeps track of how actions (independent variables) affect outcomes (dependent variables).
Simple linear regressions with one independent variable and one dependent variable or multiple linear regressions with two or more independent variables are two examples of these statistical models. According to the application and the types of variables involved, a variety of regression approaches are available and can be used.
Organizations can use scenario analysis, sometimes known as “what-if” analysis informally, to plug in new independent variables and evaluate how they affect the result by describing the relationship between variables.
A firm may discover a link between the color of the product and the chance of purchase by examining the relationship between the two. For example, blue shirts may be associated with higher sales. The company may investigate how other characteristics, such as size, seasonality, or product positioning, affect the probability to purchase because correlation does not imply causation.
Classification models
Based on prior knowledge, classification models group data into categories. A training dataset with all of the data labeled at the outset is used for classification.
Any new data is classified by the classification algorithm when it learns the relationships between the labels and data. Text analytics, random forests, and decision trees are some common categorization model strategies. Many sectors utilize classification models because they are simple to retrain with fresh data.
To predict what future fraudulent transactions would look like, the system can examine millions of recent transactions. It can also notify users when behavior on their account becomes suspect.
Clustering models
Data are grouped using clustering algorithms based on related features. A data matrix is used in a clustering model to link each item to pertinent attributes.
The algorithm will group items with the same features using this matrix, revealing patterns in the data that may have previously been concealed.
Clustering models can be used by businesses to categorize their clients and develop more specialized marketing plans.
For instance, a restaurant might group its patrons according to where they are and only distribute flyers to patrons within a specified driving distance of its most recent location.
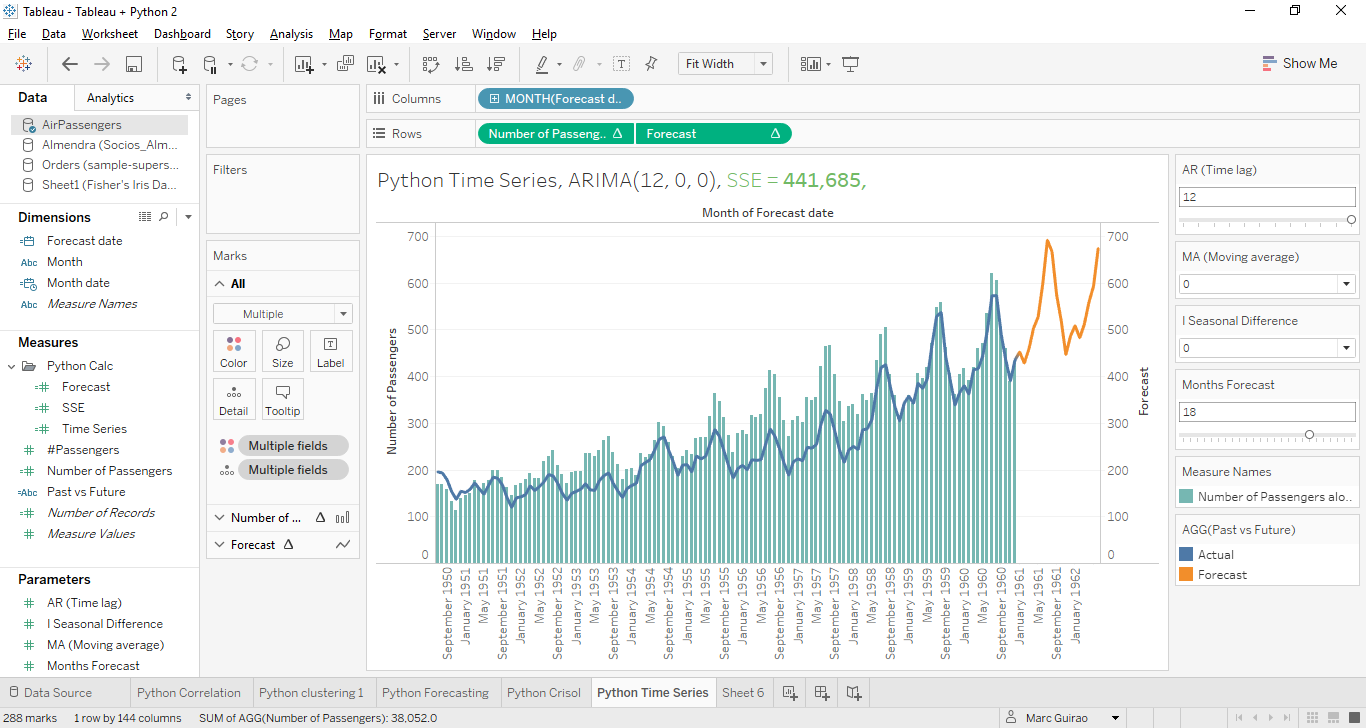
Time-series models
Data points are recorded using time series models. Time is one of the most frequently used independent variables in predictive analytics since so much of the world’s data can be described as a time series.
A typical model might use the data from the prior year to analyze and forecast a statistic for the next weeks. Organizations can foresee and investigate many possibilities without wasting time or effort because of Tableau’s comprehensive analytics tools.
This model can be applied to trend analysis, which charts the movement of assets over time, or seasonality analysis, which forecasts how assets are affected by specific periods of the year.
Why is predictive analytics important?
Organizations can use predictive analytics to be more proactive in their daily operations by seeing trends that might help them make wise decisions. Organizations no longer need to rely on informed guesses thanks to the predictive models described above because forecasts offer more information. Although the advantages of predictive analytics differ by business, the following are some typical justifications for forecasting.
- Increase margins of profit: Forecasting inventories, developing price plans, predicting consumer numbers, and even configuring store layouts to increase sales can all be done with predictive analytics.
- Optimize marketing campaigns: Adapt marketing plans, keep essential consumers, and take advantage of cross-selling opportunities with the help of predictive analytics, which may uncover new customer insights and forecast actions based on inputs.
- Reduce risk: To speed up response times and minimize bad outcomes, predictive analytics can identify out-of-the-ordinary behaviors like fraudulent transactions, corporate espionage, or cyberattacks.